Early this morning, we finished our last station off the coast of California in calm seas. Now it gets busy on the ship, people are disassembling their setups and packing boxes as we are slowly steaming into the port of San Diego. The last couple days the ship was rolling quite a bit, but we could keep on measuring and managed to finish all stations as planned. Thanks everyone - crew and science team - for a successful and fun cruise!
Saturday, June 1, 2013

Thursday, May 30, 2013
ODF: Techs for Hire
There are four techs onboard from Scripps Institution of Oceanography’s Oceanographic Data Facility (ODF). We are multi-purpose – running analyses, collecting samples, helping with deck operations and managing the huge amounts of data collected during the cruise.

Left: Melissa draws oxygen samples. Center: Melissa with the nutrient rig. Right: Susan keeps riff-raff out of the analytical lab.
ODF is in charge of the nutrient and oxygen analysis taking place in the analytical lab, just forward of the main lab. Nutrients (nitrate, nitrite, phosphate and silicate) are analyzed by splitting the water sample into four sets of glass coils, one for each analyte. Reagents are added and the resulting chemical reaction causes a color change proportional to the nutrient concentration as measured with a photometer. The analysis of dissolved oxygen encompasses photometric end-point detection based on the absorption of ultra-violet light.

Left: Alex checks the titration endpoint. Right: Mary, data-wrangler extraordinaire.
We work in 12 hour shifts, one nutrient and one oxygen analyst per shift so that samples are run as quickly as possible after they come up from the depths. Having the data to look at so quickly helps us see if there are any problems with the bottles or carousel before they’re put back in the water. Our data tech maintains an internal website where all the groups upload their data and can plot theirs with that of other groups onboard. Data from the CTD and other sensors on the rosette are also quickly uploaded to this site for easy comparison with the bottle data. Keeping up with data is a constant task when there are so many different groups of scientists on board all studying the same water for their various, inter-related properties.
There are other technicians on this cruise from our broader department, Shipboard Technical Support, including members of the electronics group, restechs (resident technicians) and computing resources group, who run deck ops, analyze samples and keep all the shipboard computers running smoothly.

Alex helps with CTD recovery
Back on shore we do much of the same work, along with other instrument and support services. We have offices and labs in a building on the SIO campus and at the Marine Facility in Point Loma, where the SIO research vessel fleet is tied up. Sometimes we go out to sea in a group, like on this cruise, and sometimes it’s just one of us that is needed for a job. On average we spend about 100 days at sea every year, though it’s sometimes a lot more.
by Melissa Miller
Saturday, May 25, 2013
Dating water
The concept of water age was completely foreign to me before starting graduate school. How can the ocean have anything but one age, i.e. really, really old? I soon realized that oceanographers definition of age refers to the time elapsed since a water parcel was last in contact with the atmosphere. As an aside, the year in which the water left the surface is known as the vintage, as in “I have a fine bottle of Southern Ocean seawater vinted in 1982 for your enjoyment.” From a physical standpoint, we can use age, amongst other things, to figure out how quickly water in the ocean is transported around and which areas are flushed more rapidly with water that comes from the surface. Age is also important from a biogeochemical point of view. For example, if the water’s age is more than 300 years old, it came from a time when anthropogenic carbon dioxide wasn’t significant.
How do we figure out the age of a water parcel? This is where chlorofluorocarbons (CFCs) (among other tracers) come in. CFCs were used as propellants and refrigerants starting about 1920s and increased exponentially until the early 1990s when their use was banned because they caused damage to the ozone in the upper atmosphere. Once in the ocean, they are essentially inert, so we can match a water sample’s CFC concentration to the year when the atmosphere had the same concentration (as illustrated in the cartoon below, courtesy of Michelle Weirathmueller).

So what does CFC data look like? Generally speaking, it’s high near the surface and decreases the deeper you go reflecting the fact that the shallower water were exposed more recently to an atmosphere with higher CFC concentrations (check out my not-so-amazingly accurate hand contour of our data thus far). The current 2013 P02 CLIVAR / CO2 cruise is repeating a section first taken in 1994, repeated in 2004. By comparing these different data together, we can get a sense of how the oceanic circulation has changed over the past few decades and perhaps provide a physical explanation for some of the changes the other measurement groups on this cruise have observed.

Carefully hand-contoured plot of CFC-11 measurements. The vertical axis is depth, the horizontal axis station number and longitude. Yellow shows the highest concentration.
by Andrew Shao
Thursday, May 23, 2013
The Captain
Captain Dave, Master of the R/V Melville, is a great captain to sail with. He also likes to make sure that we have some fresh fish on the table every few days or so. Apparently early morning which happens to be his time on the bridge (4am-8am) is the best time to spot and catch fish. A couple of days ago some mahi-mahi were caught.


Captain Dave Captain Dave and Melissa
The Gang
We managed to shoot a group photo yesterday with just two (out of 28) members of the science party missing. Everyone looks pretty happy even the ones (about half) who have been on the ship for both legs of P02 since March 21. We are at ~ 136W now which is about 80% across the Pacific from Japan. Ten more days to go!

Monday, May 20, 2013
Warning! Splash Zone!
If you don’t want to get wet, stay at least 4 feet away from dear Rosy during sampling time. As soon as the Rosette is brought into the hangar, eager students, technicians, and scientists flock to the 10-liter Niskin bottles with their sampling tubes and containers to retrieve seawater from specific ocean depths. The first description that comes to mind: Ordered chaos.

Calls of numbers echo off of the hangar walls and trail off into the wind as we steam to the next station. “127 on 5!” announces the chlorofluorocarbon (CFC) team representative, indicating which syringe he will be using to extract the seawater from Niskin 5. “4.8 [degrees C] on 4!” declares the oxygen sampler after measuring the temperature of the seawater contained in Niskin 4. All these numbers may be meaningless to the uninformed bystander casually walking past the hangar during sampling time, but they are crucial to minimizing contamination of the samples, and ensuring that all the necessary information is kept in order.
Who is responsible for maintaining the law of the sampling order? The sample cop. With the sample log and pencil in hand, the sample cop keeps track of who has taken what sample from each bottle so that no one goes out of turn. The order is as follows: CFCs, Helium, Oxygen (O2), Dissolved Inorganic Carbon (DIC), pH, Total Alkalinity, Radiocarbon (13C and 14C), Dissolved Organic Carbon, Tritium, Nutrients, and Salinity. All of these measurements are the basis of the CLIVAR/CO2 repeat hydrography program. In conjunction, they will lead to inferences about climate variability and the carbon cycle.

There is a method to the sampling madness. The order is determined based on the effects that extracting of the sample will have on the chemical property under examination. This is why CFCs must go first. Because these anthropogenically produced compounds have only existed in the atmosphere for approximately 70 years, deep water, which has not been in contact with the atmosphere for more than 1000 years, holds no CFCs. Thus, if the sample of seawater happens to be exposed to open air during extraction, it will attempt to equilibrate, taking up CFCs from the air. This is detrimental to the accuracy of the concentration readings that the science team has so diligently worked to achieve.
This problem is not unique to CFCs, however. In addition to atmospheric contact, many samplers must be weary of microbial growth in their samples. Biological effects on the chemical properties of seawater are immense, and are generally strongest in the upper 1000 meters in situ. Under laboratory conditions, however, these processes can occur rapidly in water taken from all depths. Thus, it is crucial to poison samples with mercuric chloride, or alternative poisons, to eliminate species growth as soon as possible.

All of the measurements taken on this CLIVAR/CO2 cruise have to correct for possible errors, despite the care taken during extraction. Fortunately, there are several measurements which are taken more than one way, and thus, can be compared against each other for accuracy. Among these are salinity, temperature, and O2. The utilization of various instruments and measurement techniques to determine the best results is of the upmost importance to this repeat hydrography program. Hopefully, such diligence will prove fruitful in determining climate variability, and making further predictions about the fate of our world in a global warming scenario.
by Angelica Gilroy and Yongming Sun
Sunday, May 19, 2013
When something breaks...

…it's great if you can fix it! Today, the overboarding block on the A-frame broke. We need it to re-direct the wire coming from the winch in the middle of the ship over it's side and down into the ocean. Many kilometers of wire have been running up and down over this block that is basically a very big wheel made out of steel. Right now, our stations are about 5000 meters deep, so there are 10 kilometers of wire running over the block every eight hours. And it's a heavy load! Depending on the depth that the rosette is at, the tension on the wire is between 1000 and 4000 pounds - hardly surprising that it breaks at some point! Luckily, we had a spare block with us on the ship and our experienced crew could fix it in less than an hour to get us going again. Thanks!

Thursday, May 16, 2013
This is how we do it

We use a Rosette to collect water samples and take CTD/LADCP profiles at many stations in the Pacific Ocean along 30°N from Hawaii to California. The Rosette, kindly referred to as Rosy, has 36 Niskin bottles around its brain (carousel) and a number of sensors at the bottom. Here, after diving 5900 meters to the bottom of the ocean, our Rosy is gloriously coming back from her journey to the deep sea.

Our CTD team welcomes her aboard and helps out by dragging her with hooks and tag lines. Once on board, she is being railed back to its home where a team of scientists is waiting to collect ocean water samples from the Niskin bottles, which were tripped at different depths. The water samples are needed to measure the chemical composition of water to infer, for example, the CO2 cycle in the ocean – an important factor driving the climate variability. These are time consuming laboratory measurements that cannot be done in-situ. In turn, the data collected from the sensors is sent over the wire to the ship's main lab where it is recorded and visualized in real-time during the cast.

The CTD sonde has sensors measuring Conductivity, Temperature and pressure (that gives us Depth). Other sensors include the transmissometer measuring water clarity, dissolved oxygen - O2 concentration, and fluorometer - tiny biomass. The altimeter (green box) is used to precisely determine the distance to the ocean floor so that the Rosette doesn't hit the bottom as it goes down - the sensors are very sensitive and we don't want to damage them. The yellow cylinder with blue bottom is the Lowered Acoustic Doppler Current Profiler (LADCP), which measures strength and direction of ocean currents.
by Yeping and Georgy
Carbon in seashells
A large portion of carbon is stored in minerals that were formed by marine organisms over millions of years. Some plankton (marine organisms that drift at the surface of the ocean) form tiny shells made of calcium carbonate, the same mineral in beach shells and limestone riverbeds. Once the organisms die, the shells slowly sink along with bits of other types of plankton. Some of the shells dissolve as they fall deeper into the ocean, shifting the distribution of carbon dioxide and its related forms in the ocean.
I am interested in quantifying the amount of carbon dioxide transferred due to calcium carbonate formation and dissolution, where in the water column this dissolution occurs, and the mechanisms of dissolution within the water column. I am particularly interested in the coastal systems, where time scales of circulating deep water are generally shorter and biological productivity is often greater. Since calcium is the other half of calcium carbonate, I have been developing a lab-based measurement to analyze calcium in the seawater samples I have collected along the San Diego coast and on this CLIVAR/CO2 cruise.

John measuring pH - another part of the carbon system
In the future, I plan to apply this calcium measurement to study the formation and dissolution of calcium carbonate in other ecosystems around the world including coral reefs (corals skeletons are calcium carbonate) and rivers (dominant source of most salts to the ocean, including calcium). I am also working on a separation technique and sensor for seawater that can be tuned to measure calcium among other chemicals in the ocean.
I think the science is pretty cool on its own, but traveling and living by the ocean (Scripps Institution of Oceanography - San Diego, CA) are definite perks to the job. Although, I don’t think of it as a job, it’s just part of my life : )
by John Ballard
Wednesday, May 15, 2013
I Am 15.
Greetings,
My name is 15. I’m tall, white, and thin. I enjoy spending my time outside with friends and taking a dip in the water every now and then. I don’t have milkshakes, or a yard for that matter, but what I do provide always brings all the boys (and girls) back to see me. I’m not shallow. Never. Well, I guess it depends on your perspective (pierspective?) However, I believe it’s what’s inside that counts. I’ve been all over the world. Right now, I’m somewhere over the Pacific Ocean. No one ever tells me exactly. I just know we left Hawaii a few days ago and we’re on our way to San Diego. Everyone seems to be nice on this ship. There are a few characters of suspicion though. One individual seems to be a basketball player. He’s always wearing basketball shorts. Where does he practice? I heard a crewmember from the last Leg was wearing an orange G-string too. Whatever floats your boat. Freak. I’ll talk more about them and others later. The Pacific is really living up to its definition so I’m going to enjoy the weather before I check out the water in a few hours.
All is well.
Sunday, May 12, 2013
Safety first!
While waiting for the ship to arrive on station, the night watch tries to put on immersion suits. They keep us warm in the (very unlikely) case that we have to leave the ship and get into one of the lifeboats. The goal: Be all dressed within one minute!

Yeping getting ready

Rob helping Georgy

Andrew - almost done!

Gunnar all zipped up
Friday, May 10, 2013
Test station
Thanks to a 2.5 day steam to our starting point, we had time for a test cast (yesterday). One big question is: Will all bottles close (except for one that is dismounted) and will they all trip at the right depth? There have been some problems prior to this. The answer is "yes" at least for this station. We are crossing our fingers for future casts.
Bringing the 36-place rosette out.
Waiting for sampling: Meghan, Andrew, Alex, Zoe, Cynthia, Gunnar (sample cop) and Julie.
by Sabine Mecking
Wednesday, May 8, 2013
On our way
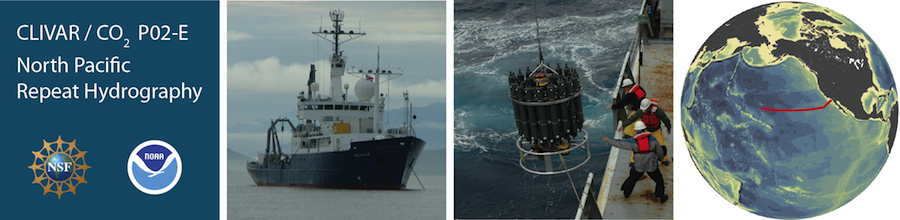
Crew and scientists are looking back at Honolulu as the R/V Melville is leaving port. We are headed toward the point (30°N, 167.45°W) where leg 1 stopped measuring about a week ago. There we will pick up work to finish section P2 across the Pacific all the way to San Diego, covering the eastern portion of the North Pacific basin (hence the E!).
Why are we doing this? What makes a group of 28 scientists plus crew spend several weeks out at sea, often under adverse conditions? In short: We would like to understand more about how the ocean works, what drives it, how it changes and what causes these changes.
Section P2 across the North Pacific at nominally 30°N is part of the U.S. CLIVAR and Carbon Repeat Hydrography Program that consists of several trans-ocean sections intended to be measured approximately every 10 years. The P2 section was last occupied in 2004 and prior to that in 1993/1994.
The CLIVAR (Climate Variability and Prediction) aspect of the program aims at understanding climate variability in the oceans. How much of the global warming is transferred to the deep ocean? Does this change circulation patterns of the oceans and are there potential consequences for the atmosphere, so-called feedbacks? The Carbon Program is concerned with how the increasing amount of CO2 in the atmosphere – one of the most prominent CO2 measuring stations is actually right in Hawaii near the top of Mauna Loa - affects the ocean and how much of it is transferred to and stored in the ocean. These are just a few of the key questions that oceanographers and atmospheric scientists would like to answer, and we will introduce more during the upcoming weeks.
To answer many of these questions, high-quality ocean data are needed. There are satellites that supply a large amount of data from the ocean surface, but they can not look into the ocean interior, i.e. below the surface. In recent years, autonomous instruments have been deployed all over the globe to measure the upper 2000 meter of the world's oceans. They do an excellent job at this, but most of them do not go to greater depths and they do not carry sensors for all of the ocean properties we are interested in. Thus, scientists (like us) still have to go out to sea to collect water sample data from a ship the good old way.
Here on the R/V Melville, several groups are measuring physical and biogeochemcial properties of the ocean such as salinity, temperature, velocity, oxygen, dissolved carbon, nutrients and many more. Hopefully, there will be a chance to meet all of the groups on this blog as our trip continues!

Looking back at Honolulu
by Gunnar Voet and Sabine Mecking
In port
R/V Melville is having its port stop in Honolulu between leg 1 (P2W) and 2 (P2E) of the trans-Pacific section P2 from Yokohama to San Diego. The only new equipment loaded is the CFC system, and the CFC team is working hard to set it up. They think they have made some progress and are hoping that Dr Min's system's maiden voyage will be successful. Other groups are enjoying the Hawaiian beaches and are recovering from a lengthy leg 1. Still everyone is excited to be sailing again soon. Aloha!

The CFC team giving their thumbs up to a running system.

R/V Melville in port in Honolulu getting ready for leg 2.
by Sabine Mecking and Gunnar Voet
Subscribe to:
Posts (Atom)